Optimizing a React SPA Part 2: Profilers and Finding Bottlenecks
Tools of the Trade
I'm a cross-platform (Windows/Linux) dev with deep experience in C# and the .Net stack (from legacy 1.1 through core and .Net 5). I like creating developer tools and teaching others about code and architecture.
Knowing how to find the bottlenecks in your code can be more important than knowing how to fix them. After all it's impractical to attempt to optimize everything in one shotgun blast. This is where the right tools will make a huge difference.
Chrome Performance Profiler
If you use Google Chrome (or a browser based on the Chromium Project, you should have access to a version of Chrome's performance profiler.
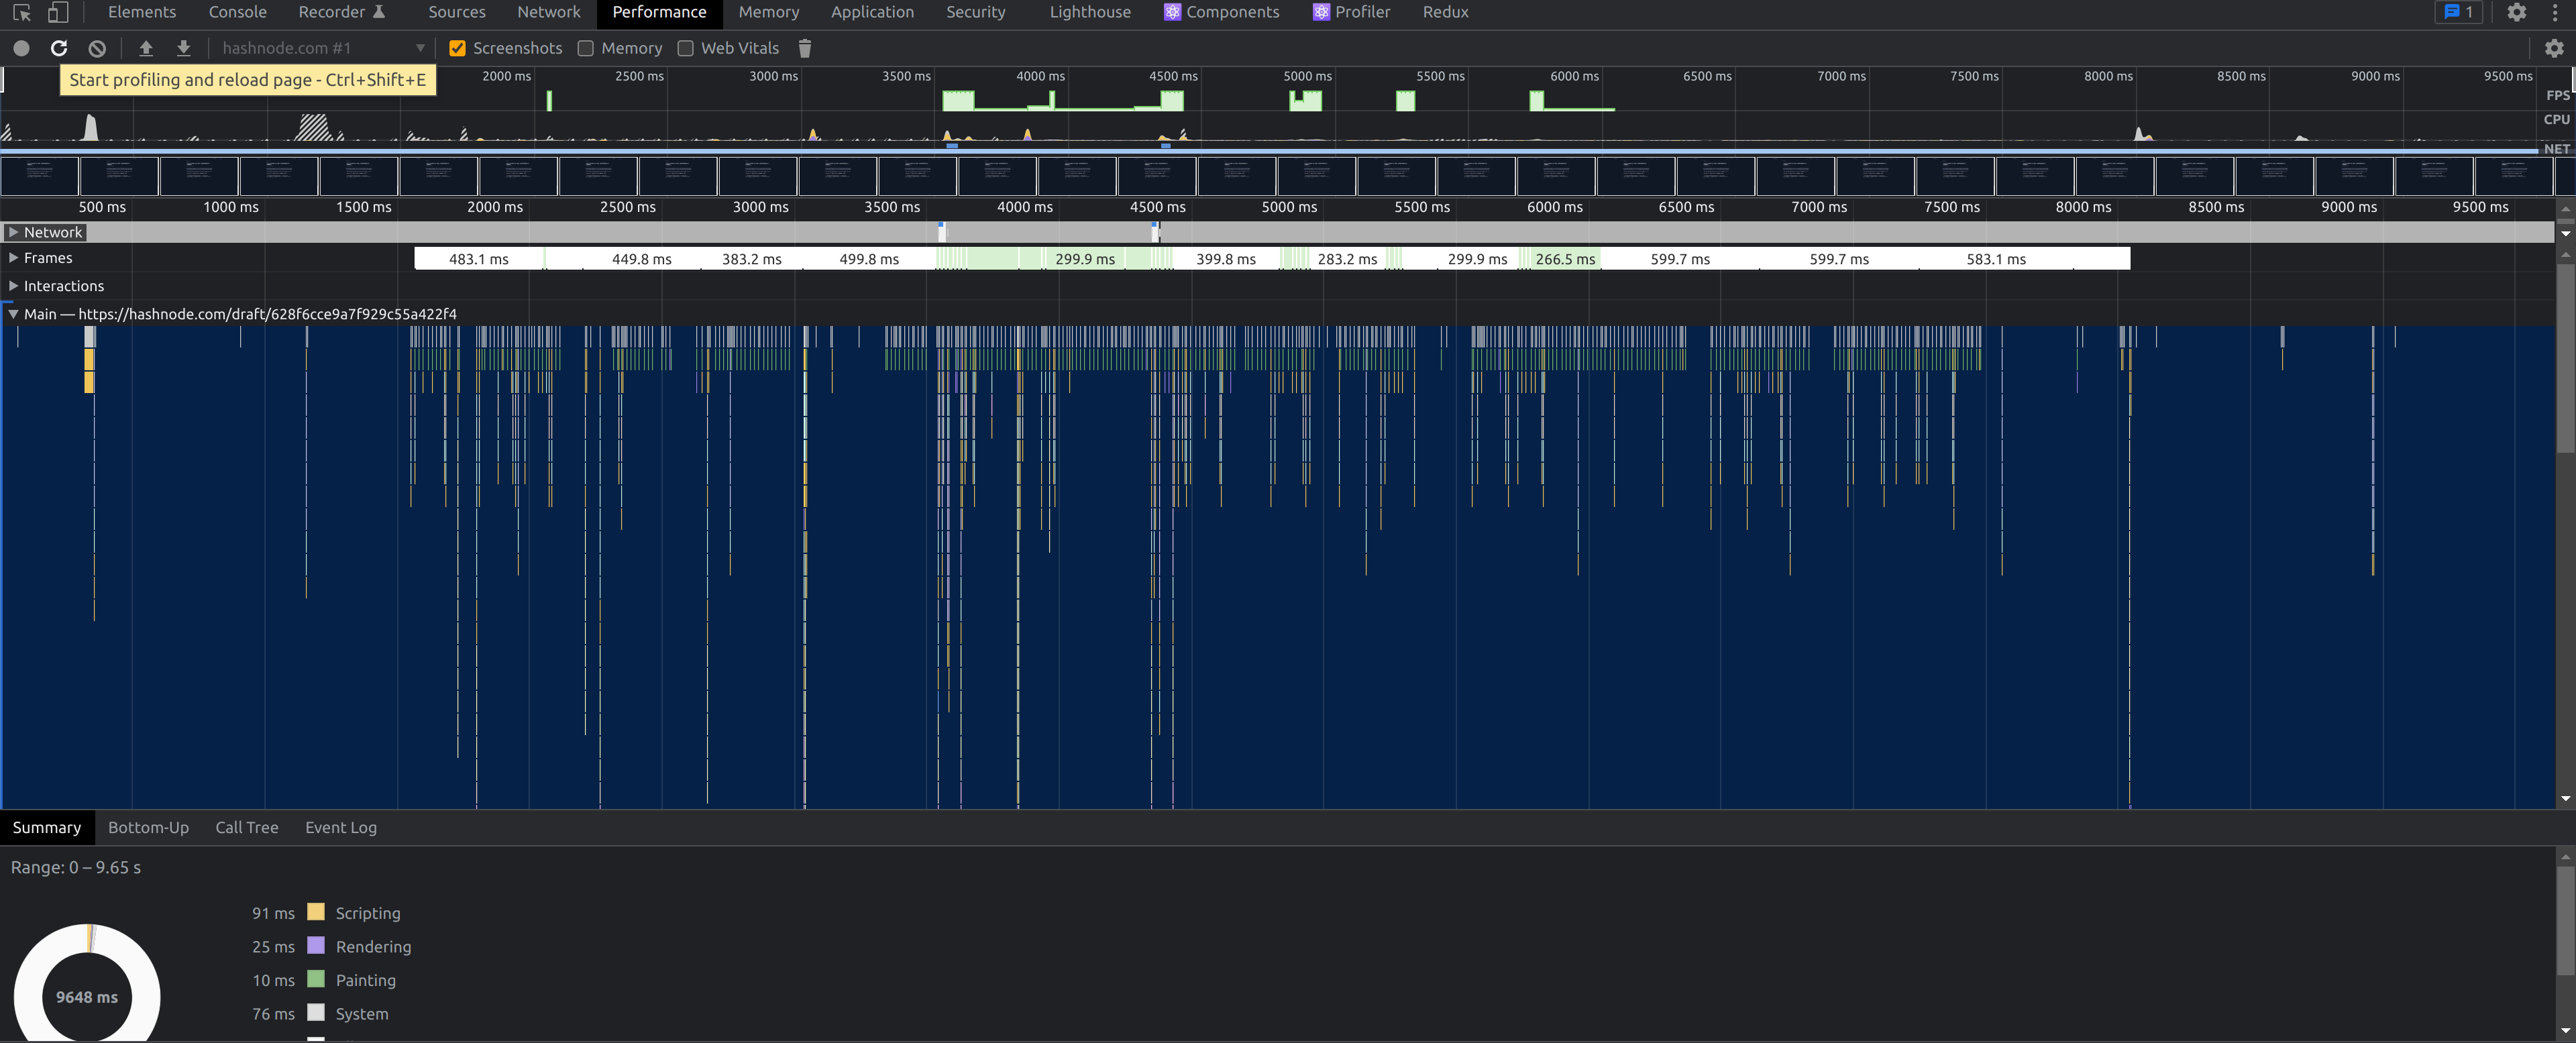
That middle section is the "Flame Graph". Each bar represents a function call and the width indicates how long it took to run. Each bar below another bar is a function that was called in the bar above it. Now in React, a lot of this will not be your code so you need to look for function names that you recognize.
Running this in production will likely present you with obfuscated function names. If possible, try a a development build pointed to the same data, or deploy non-minified build to make it easier to read. Otherwise you will end up guessing based on behaviors and built-in functions like map or filter.
Chrome Task Manager
When you're knee-deep in memory and the waters are rising, you need to find out if it's your app taking up all that memory, or if some extensions or even another tab is the culprit.
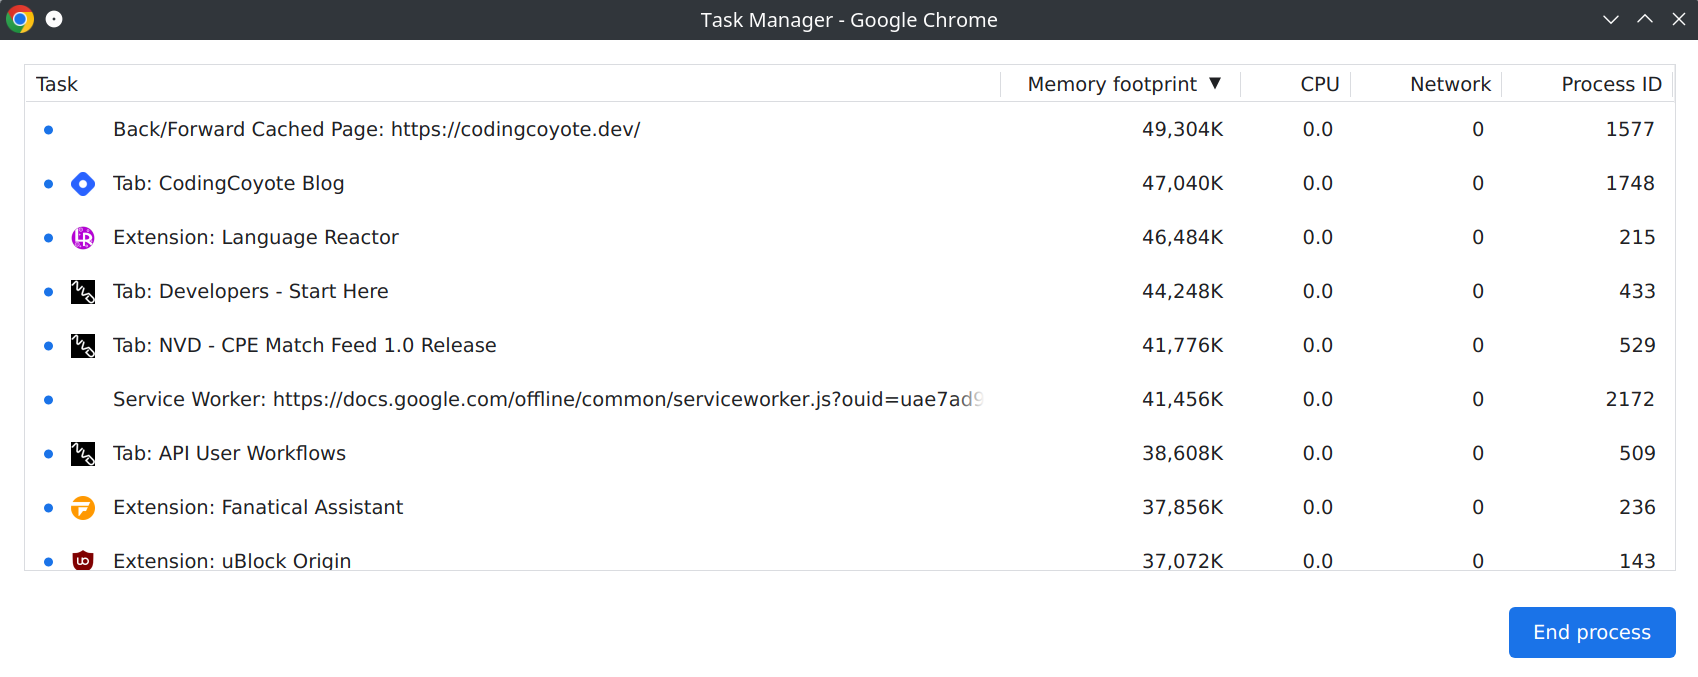
There are several key columns here and the one we are most interested in is not available by default. With developer tools open, right-click and select JS Heap to see the actual heap (memory used by your code) size. You can watch this as you trigger suspect regions of code. Generally heavy allocations are slower, and sudden rises that don't fall away could mean frequent allocations, memory leaks, or inefficient code.
But, pay attention to differences in native memory and JS Heap. The native memory size includes detached Dom Elements (elements referenced by code, but not part of the page).
Edge Detached Elements Tool
This is a tool that is so far exclusive to Edge but is just a simplified view of the memory snapshots in Chrome. If you choose to go this route, only worry about Detached elements that stick around or build up quickly. Any elements created in javascript (including elements from past renders in React) will detach before being cleaned up by the next garbage collection pass. If you see them building up, you may be holding references to these elements somewhere in your code.
Single Threaded Environment
Remember above all that the web page runs on a single Thread. Web Workers and Service Workers get around this using background threads, but async and synchronous code all run on the same thread. So SignalR updates, async API calls and long-running functions are all dependent on thread running them. Frequent async operations to update the model or cache can delay other calls or cause stuttering depending on what is being done.